Surface Water Quantity Monitoring Sites and Objectives
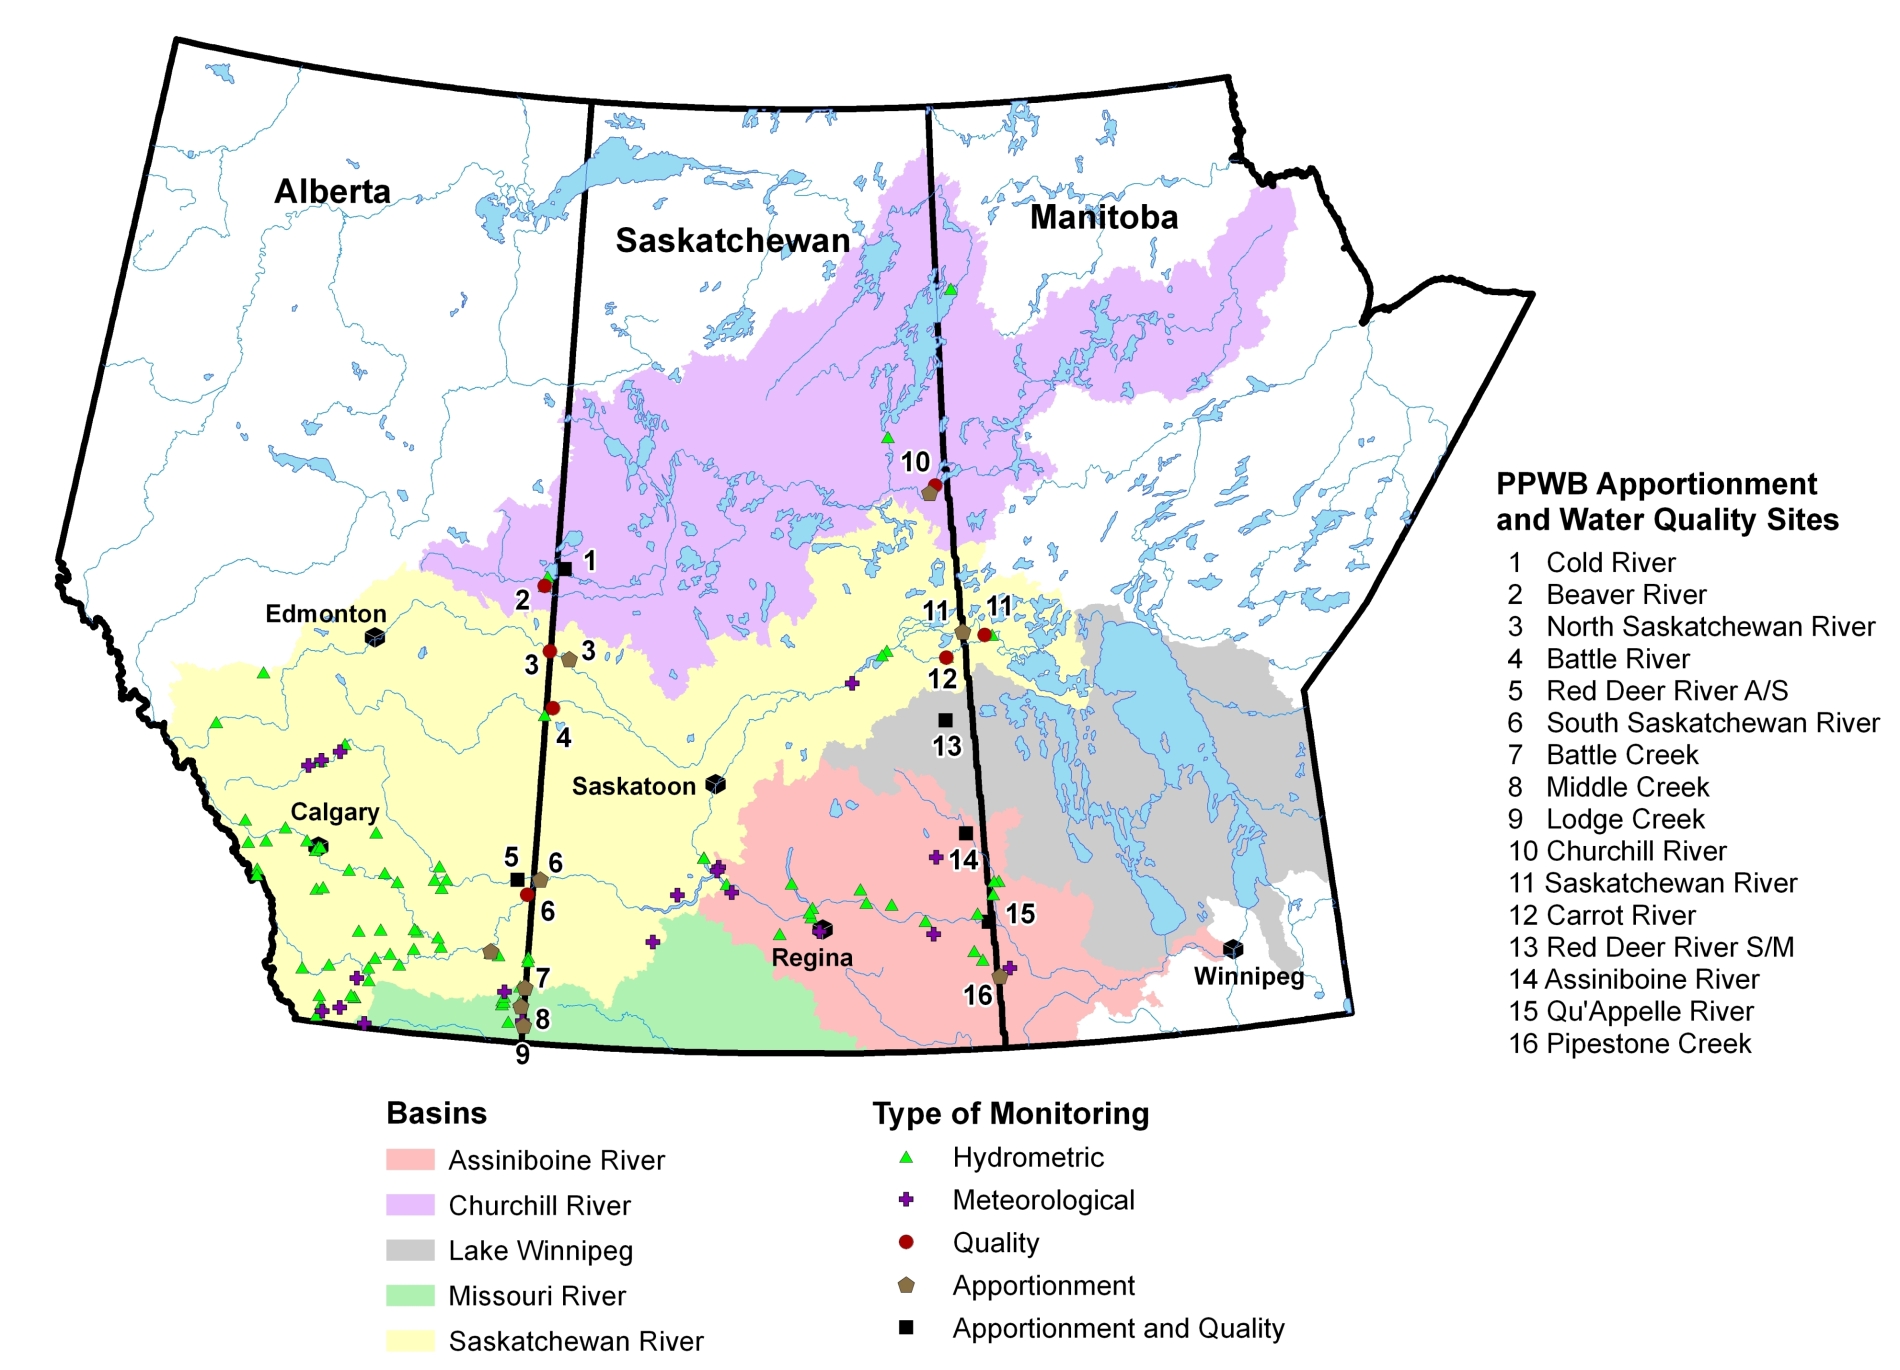
The federal government is responsible to conduct monitoring at the PPWB sites. Environment Canada - Water Survey of Canada and other partners collect hydrometric and meteorological data at these and other sites. The PPWB uses these data and water use data to compute apportionable flows at 12 sites on the Alberta-Saskatchewan and Saskatchewan-Manitoba borders.
Flow data can be found below for each river in both graphical and tabular formats. Tables are in html format so users can select the table then copy and paste directly into spreadsheets, word processing and some graphical software packages.
The user can also obtain both historic and real-time recorded flow data for all stations monitored by Environment Canada - Water Survey of Canada.
Apportionable flows were calculated for Battle Creek at Alberta-Saskatchewan border (station 11AB117).
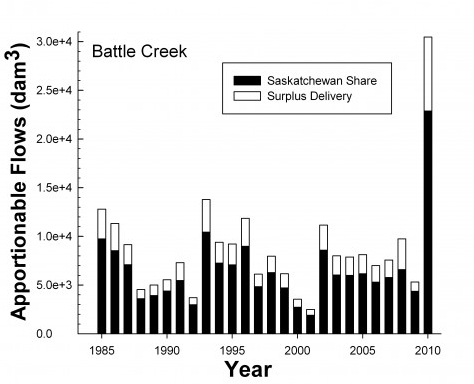
The black bar shows the amount of apportionable flows that were required to be delivered by Alberta to Saskatchewan. The white bar shows the flow surplus amounts that were delivered in excess of required flows. The combined black (provincial share) and white (surplus) stacked bars show the total recorded flows. On the y-axis, the number following the "e" in the Scientific Notation shows how many zeros should be placed to the right of the decimal place.
Under the principle of equitable sharing in the Master Agreement on Apportionment, Saskatchewan's share of apportionable flows on the Battle Creek is 75% to enable the use of the waters by Saskatchewan and still fulfill Canada's commitments to deliver 50% of the Milk River into the USA. Battle Creek feeds into the Milk River in Saskatchewan.
Alberta has always met their delivery requirement throughout the entire data record.
You can copy and paste flow data presented below into a spreadsheet and word processing file.
Year | Recorded Flow | Apportionable Flow |
|---|---|---|
(Unit: dam3) | ||
1985 | 12,800 | 13,000 |
1986 | 11,320 | 11,380 |
1987 | 9,150 | 9,454 |
1988 | 4,535 | 4,815 |
1989 | 5,000 | 5,236 |
1990 | 5,543 | 5,855 |
1991 | 7,303 | 7,299 |
1992 | 3,705 | 3,980 |
1993 | 13,781 | 13,921 |
1994 | 9,400 | 9,669 |
1995 | 9,212 | 9,440 |
1996 | 11,855 | 11,977 |
1997 | 6,127 | 6,460 |
1998 | 7,966 | 8,383 |
1999 | 6,168 | 6,292 |
2000 | 3,551 | 3,637 |
2001 | 2,497 | 2,536 |
2002 | 11,157 | 11,448 |
2003 | 8,001 | 8,043 |
2004 | 7,887 | 7,998 |
2005 | 8,123 | 8,225 |
2006 | 6,996 | 7,063 |
2007 | 7,574 | 7,695 |
2008 | 9,750 | 8,890 |
2009 | 5,320 | 5,820 |
2010 | 30,464 | 30,499 |
| Total | 225,185 | 229,105 |
Apportionable flows are calculated for the Churchill River at Sandy Bay (station 06EA002).
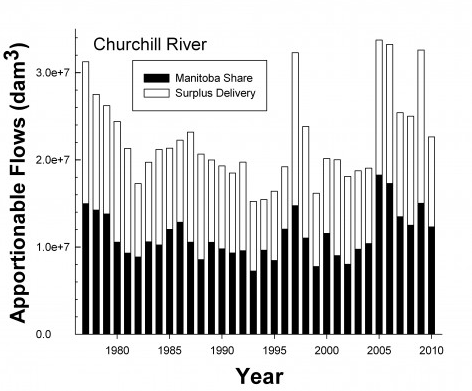
The black bar shows the amount of apportionable flows that were required to be delivered by Saskatchewan to Manitoba. The white bar shows the flow surplus amounts that were delivered in excess of required flows. The combined black (provincial share) and white (surplus) stacked bars show the total recorded flows. On the y-axis, the number following the "e" in the Scientific Notation shows how many zeros should be placed to the right of the decimal place.
Under the Master Agreement on Apportionment, Manitoba's share is 50% of the apportionable flows of the Churchill River.
Saskatchewan has always met their delivery requirements throughout the entire data record.
Flow data presented below can be copied and pasted into a spreadsheet or word processing file.
Year | * Estimated Flow | Apportionable Flow |
|---|---|---|
(Unit: dam3) | ||
1977 | 31,244,095 | 29,936,604 |
1978 | 27,506,645 | 28,493,431 |
1979 | 26,200,000 | 27,600,000 |
1980 | 24,440,000 | 21,100,000 |
1981 | 21,300,000 | 18,593,000 |
1982 | 17,270,000 | 17,729,000 |
1983 | 19,720,000 | 21,2000,00 |
1984 | 21,190,000 | 20,480,000 |
1985 | 21,340,000 | 24,050,000 |
1986 | 22,240,000 | 25,670,000 |
1987 | 23,170,000 | 21,090,000 |
1988 | 20,650,000 | 17,100,000 |
1989 | 19,980,000 | 21,064,000 |
1990 | 19,300,000 | 19,580,000 |
1991 | 18,480,000 | 18,630,000 |
1992 | 19,730,000 | 19,150,000 |
1993 | 15,229,000 | 14,480,000 |
1994 | 15,440,000 | 19,237,000 |
1995 | 16,400,000 | 16,900,000 |
1996 | 19,200,000 | 24,100,000 |
1997 | 32,280,000 | 29,480,000 |
1998 | 23,820,000 | 22,057,000 |
1999 | 16,160,000 | 15,502,000 |
2000 | 20,140,000 | 23,123,000 |
2001 | 20,010,000 | 18,015,000 |
2002 | 18,080,000 | 16,048,000 |
2003 | 18,740,000 | 19,476,000 |
2004 | 19,050,000 | 20,786,000 |
2005 | 33,730,000 | 36,503,000 |
2006 | 33,230,000 | 34,572,000 |
2007 | 25,405,000 | 26,939,000 |
2008 | 25,000,000 | 24,980,000 |
2009 | 32,580,000 | 30,030,000 |
2010 | 22,626,900 | 24,607,320 |
Total | 760,881,640 | 747,101,355 |
* Estimated flow includes recorded flow at Sandy Bay and estimated inflow from Sandy Bay to the border.
Apportionable flows are calculated for the Assiniboine River at Kamsack (station 05MD004).
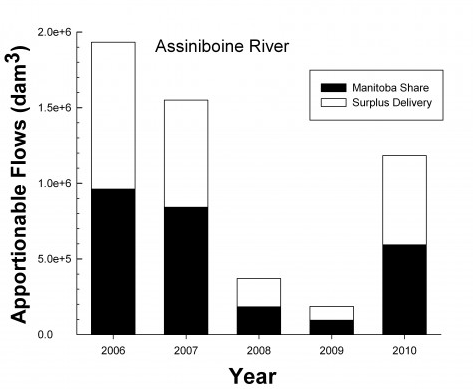
The black bar shows the amount of apportionable flows that were required to be delivered by Saskatchewan to Manitoba. The white bar shows the flow surplus amounts that were delivered in excess of required flows. The combined black (provincial share) and white (surplus) stacked bars show the total recorded flows. On the y-axis, the number following the "e" in the Scientific Notation shows how many zeros should be placed to the right of the decimal place.
Under the Master Agreement on Apportionment, Manitoba's share is 50% of the apportionable flows of the Assiniboine River.
Saskatchewan has always met their delivery requirements throughout the entire data record.
Apportionment flows have been computed since 2006 although flows have been recorded for longer.
Apportionment flows have been computed since 2006 although flows have been recorded for longer. You can copy and paste flow data presented below into a spreadsheet or word processing file.
Year | Recorded Flow | Apportionable Flow |
|---|---|---|
(Unit: dam3) | ||
1957 | 256,638 |
|
1958 | 34,242 |
|
1959 | 29,263 |
|
1960 | 227,876 |
|
1961 | 5,711 |
|
1962 | 75,051 |
|
1963 | 27,952 |
|
1964 | 37,728 |
|
1965 | 167,562 |
|
1966 | 273,701 |
|
1967 | 166,202 |
|
1968 | 36,497 |
|
1969 | 92,134 |
|
1970 | 166,506 |
|
1971 | 264,317 |
|
1972 | 345,957 |
|
1973 | 78,614 |
|
1974 | 413,089 |
|
1975 | 447,958 |
|
1976 | 452,830 |
|
1977 | 46,999 |
|
1978 | 71,038 |
|
1979 | 405,657 |
|
1980 | 97,652 |
|
1981 | 41,461 |
|
1982 | 58,308 |
|
1983 | 225,399 |
|
1984 | 106,100 |
|
1985 | 303,585 |
|
1986 | 217,206 |
|
1987 | 109,241 |
|
1988 | 218,044 |
|
1989 | 17,089 |
|
1990 | 144,118 |
|
1991 | 25,329 |
|
1992 | 78,179 |
|
1993 | 133,344 |
|
1994 | 129,000 |
|
1995 | 892,000 |
|
1996 | 362,000 |
|
1997 | 366,000 |
|
1998 | 136,000 |
|
1999 | 218,000 |
|
2000 | 102,000 |
|
2001 | 138,000 |
|
2002 | 15,800 |
|
2003 | 162,000 |
|
2004 | 108,000 |
|
2005 | 169,000 |
|
2006 | 595,000 | 599,493 |
2007 | 646,000 | 650,720 |
2008 | 212,000 | 218,000 |
2009 | 185,000 | 189,130 |
2010 | 1,183,000 | 1,186,000 |
Total Since 2006 | 2,821,000 | 2,843,343 |
Apportionable flows are estimated at the outlet of Cold Lake (station 06AF001).
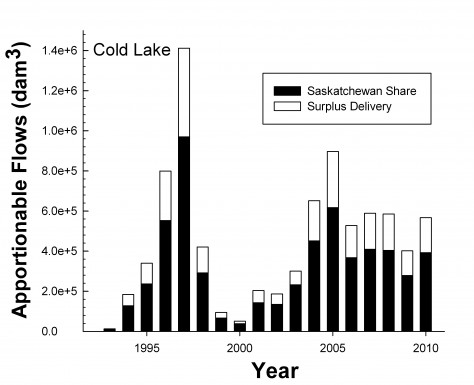
The black bar shows the amount of apportionable flows that were required to be delivered by Alberta to Saskatchewan. The white bar shows the flow surplus amounts that were delivered in excess of required flows. The combined black (provincial share) and white (surplus) stacked bars show the total recorded flows. On the y-axis, the number following the "e" in the Scientific Notation shows how many zeros should be placed to the right of the decimal place.
Under the Master Agreement on Apportionment, Saskatchewan's share is 68.4% of Cold Lake outlet's apportionable flows. The 50% general formula is adjusted to consider that some of the basin that flows into Cold Lake is within Saskatchewan. This adjustment ensures that both provinces get their equitable share, an important principle in the Agreement.
Alberta has always met their delivery requirement throughout the data record.
Flow data presented below can be copied and pasted into a spreadsheet or word processing file.
Year | *Recorded Flow | Apportionable Flow |
|---|---|---|
(Unit: dam3) | ||
1997 | 12,727 | 14,823 |
1998 | 184,286 | 186,780 |
1995 | 339,707 | 345,441 |
1996 | 799,400 | 808,100 |
1997 | 1,412,000 | 1,418,600 |
1998 | 421,110 | 426,300 |
1999 | 94,337 | 97,624 |
2000 | 51,000 | 56,678 |
2001 | 203,523 | 209,306 |
2002 | 186,951 | 196,545 |
2003 | 300,100 | 340,059 |
2004 | 651,845 | 660,241 |
2005 | 896,633 | 902,443 |
2006 | 527,738 | 536,723 |
2007 | 588,770 | 598,190 |
2008 | 585,000 | 591,000 |
2009 | 402,000 | 407,800 |
2010 | 567,000 | 574,000 |
Total | 8,224,127 | 8,370,653 |
Apportionable flows are calculated for Lodge Creek near the Alberta-Saskatchewan border (station 11AB082).
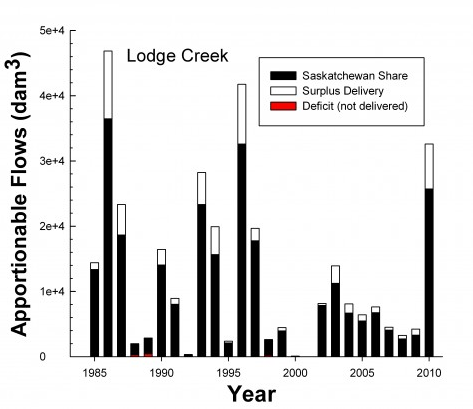
he black bar shows the amount of apportionable flows that were required to be delivered by Alberta to Saskatchewan. The white bar shows the flow surplus amounts that were delivered in excess of required flows. The red bar indicates amounts of required flows that were not delivered (i.e., deficits). The combined area indicates recorded flow as the amounts of flow deficits are subtracted from the provincial share. The required provincial share is the combined area of the black and red bars. On the y-axis, the number following the "e" in the Scientific Notation shows how many zeros should be placed to the right of the decimal place.
Under the principle of equitable sharing in the Master Agreement on Apportionment, Saskatchewan's share of Lodge Creek's apportionable flows is 75% to enable the use of the waters by Saskatchewan and still fulfill Canada's commitments to deliver 50% of the Milk River into the USA. Lodge Creek feeds into the Milk River in Saskatchewan.
Lodge and Middle Creeks are the only two rivers monitored by the PPWB that have not met apportionment requirements. Lodge Creek had small deficits in 1988, 1989, 1992, 1998, and 2000.
You can copy and paste flow data presented below into a spreadsheet or word processing file.
Year | *Recorded Flow | Apportionable Flow |
|---|---|---|
(Unit: dam3) | ||
1985 | 14,400 | 17,800 |
1986 | 46,840 | 48,610 |
1987 | 23,310 | 24,870 |
1988 | 1,718 | 2,648 |
1989 | 2,412 | 3,804 |
1990 | 16,432 | 18,723 |
1991 | 8,946 | 10,703 |
1992 | 280 | 449 |
1993 | 28,229 | 31,072 |
1994 | 19,924 | 20,875 |
1995 | 2,359 | 2,796 |
1996 | 41,739 | 43,460 |
1997 | 19,666 | 23,668 |
1998 | 2,407 | 3,490 |
1999 | 4,458 | 5,281 |
2000 | 66 | 111 |
2001 | 12 | 9 |
2002 | 8,149 | 10,453 |
2003 | 13,927 | 15,000 |
2004 | 8,077 | 8,905 |
2005 | 6,409 | 7,305 |
2006 | 7,610 | 8,978 |
2007 | 4,509 | 5,425 |
2008 | 3,260 | 3,630 |
2009 | 3,648 | 4,386 |
2010 | 32,600 | 34,300 |
* Recorded flow at the border includes flow released from Jaydot reservoir.
Apportionable flows are calculated at Middle Creek near the Alberta-Saskatchewan Border (station 11AB009)
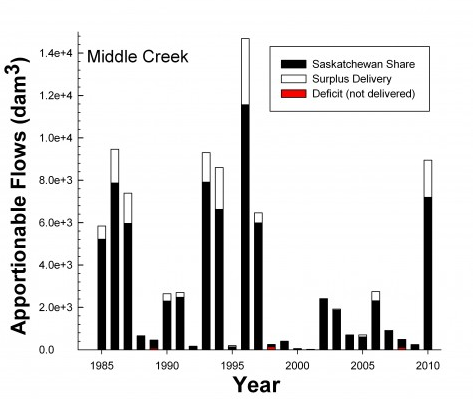
The black bar shows the amount of apportionable flows that were required to be delivered by Alberta to Saskatchewan. The white bar shows the flow surplus amounts that were delivered in excess of required flows. The red bar indicates amounts of required flows that were not delivered (i.e., deficits). The combined area indicates recorded flow as the amounts of flow deficits are subtracted from the provincial share. The required provincial share is the combined area of the black and red bars. On the y-axis, the number following the "e" in the Scientific Notation shows how many zeros should be placed to the right of the decimal place.
Under the principle of equitable sharing in the Master Agreement on Apportionment, Saskatchewan's share of apportionable flows of Middle Creek is 75% to enable the use of the waters by Saskatchewan and still fulfill Canada's committments to deliver 50% of the Milk River into the USA. Middle Creek feeds into the Milk River in Saskatchewan.
Alberta has met their delivery requirement throughout the data record, except for five years (1988, 1989, 1998, 2000 and 2008) which had deficits in delivery. The Board representatives of Alberta and Saskatchewan engaged in discussions on how to avoid these deficits, and managed to resolve the issues before conflicts developed. Middle and Lodge Creeks are the only rivers that the Prairie Provinces Water Board that has ever had any deficits.
You can copy and paste flow data presented below into a spreadsheet or word processing file.
Year | Recorded Flow | Apportionable Flow |
|---|---|---|
(Unit: dam3) | ||
1985 | 5,840 | 6,960 |
1986 | 9,464 | 10,500 |
1987 | 7,389 | 7,955 |
1988 | 643 | 880 |
1989 | 387 | 610 |
1990 | 2,646 | 3,068 |
1991 | 2,701 | 3,305 |
1992 | 168 | 197 |
1993 | 9,301 | 10,547 |
1994 | 8,599 | 8,837 |
1995 | 194 | 184 |
1996 | 14,680 | 15,418 |
1997 | 6,463 | 7,983 |
1998 | 115 | 329 |
1999 | 405 | 505 |
2000 | 47 | 76 |
2001 | 21 | 21 |
2002 | 2,412 | 3,187 |
2003 | 1,922 | 2,493 |
2004 | 703 | 909 |
2005 | 704 | 813 |
2006 | 2,744 | 3,080 |
2007 | 911 | 1,165 |
2008 | 392 | 652 |
2009 | 245 | 288 |
2010 | 8,950 | 9,600 |
| Total | 88,046 | 99,562 |
Apportionable flows are calculated at the North Saskatchewan River near Deer Creek (station 05EF001).
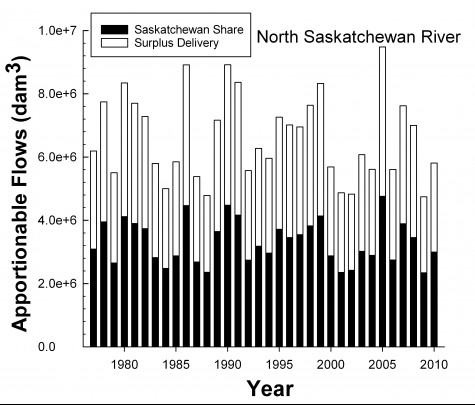
The black bar shows the amount of apportionable flows that were required to be delivered by Alberta to Saskatchewan. The white bar shows the flow surplus amounts that were delivered in excess of required flows. The combined black (provincial share) and white (surplus) stacked bars show the total recorded flows. On the y-axis, the number following the "e" in the Scientific Notation shows how many zeros should be placed to the right of the decimal place.
Under the Master Agreement on Apportionment, Saskatchewan's Share is 50% of the North Saskatchewan River's apportionable flows. Alberta has always met their delivery requirement throughout the entire data record.
Flow data presented below can be copied and pasted into a spreadsheet or word processing file.
Year | Recorded Flow | Apportionable Flow |
|---|---|---|
(Unit: dam3) | ||
1977 | 6,190,854 | 6,173,330 |
1978 | 7,746,266 | 7,894,284 |
1979 | 5,500,000 | 5,300,000 |
1980 | 8,340,000 | 8,230,000 |
1981 | 7,700,000 | 7,796,000 |
1982 | 7,280,000 | 7,470,000 |
1983 | 5,800,000 | 5,640,000 |
1984 | 5,000,000 | 4,960,000 |
1985 | 5,850,000 | 5,750,000 |
1986 | 8,911,000 | 8,931,000 |
1987 | 5,381,000 | 5,363,000 |
1988 | 4,779,000 | 4,709,000 |
1989 | 7,164,000 | 7,286,000 |
1990 | 8,917,000 | 8,953,600 |
1991 | 8,363,000 | 8,322,600 |
1992 | 5,568,000 | 5,483,400 |
1993 | 6,274,000 | 6,362,100 |
1994 | 5,959,000 | 5,927,000 |
1995 | 7,262,000 | 7,430,000 |
1996 | 7,012,000 | 6,908,000 |
1997 | 6,951,000 | 7,090,000 |
1998 | 7,639,000 | 7,648,000 |
1999 | 8,326,000 | 8,276,000 |
2000 | 5,688,000 | 5,751,000 |
2001 | 4,868,000 | 4,707,000 |
2002 | 4,826,000 | 4,842,000 |
2003 | 6,072,000 | 6,032,000 |
2004 | 5,608,000 | 5,779,000 |
2005 | 9,482,000 | 9,517,000 |
2006 | 5,604,000 | 5,489,000 |
2007 | 7,620,000 | 7,780,000 |
2008 | 7,000,000 | 6,910,000 |
2009 | 4,680,000 | 4,580,000 |
2010 | 5,809,000 | 5,987,000 |
| Total | 225,170,120 | 225,277,314 |
Apportionable flows are calculated for Pipestone Creek at the Saskatchewan-Manitoba border.
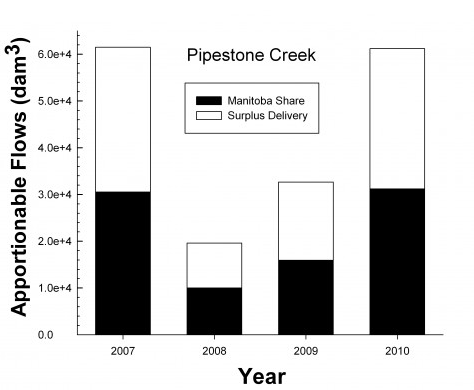
The black bar shows the amount of apportionable flows that were required to be delivered by Saskatchewan to Manitoba. The white bar shows the flow surplus amounts that were delivered in excess of required flows. The combined black (provincial share) and white (surplus) stacked bars show the total recorded flows. On the y-axis, the number following the "e" in the Scientific Notation shows how many zeros should be placed to the right of the decimal place.
Under the Master Agreement on Apportionment, Manitoba's share is 50% of the apportionable flows of the Pipestone Creek.
Saskatchewan has always met their delivery requirements throughout the entire data record. This creek was only recently added to calculate apportionable flows on an interim basis to determine whether the creek should be monitored on an on-going basis.
Recorded flows at Pipestone Creek near the Saskatchewan border (Environment Canada - Water Survey of Canada's station 05NG024) are used to compute apportionable flows at the border.
You can copy and paste flow data presented below into a spreadsheet or word processing file.
Year | Recorded Flow | Apportionable Flow |
|---|---|---|
(Unit: dam3) | ||
2007 | 61,500 | 61,083 |
2008 | 19,600 | 20,000 |
2009 | 33,000 | 31,800 |
2010 | 61,200 | 62,400 |
Total | 175,300 | 175,283 |
Apportionable flows are calculated for the Qu'Appelle River near Welby, Saskatchewan (station 05JM001).
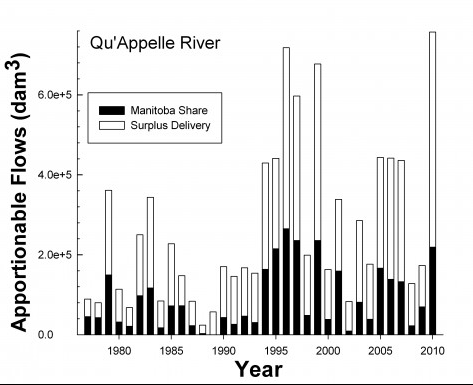
The black bar shows the amount of apportionable flows that were required to be delivered by Saskatchewan to Manitoba. The white bar shows the flow surplus amounts that were delivered in excess of required flows. The combined black (provincial share) and white (surplus) stacked bars show the total recorded flows. On the y-axis, the number following the "e" in the Scientific Notation shows how many zeros should be placed to the right of the decimal place.
Under the Master Agreement on Apportionment, Manitoba's share is 50% of the apportionable flows of the Qu'Appelle River.
Saskatchewan has always met their delivery requirements throughout the entire data record.
You can copy and paste flow data presented below into a spreadsheet or word processing file.
Year | Recorded Flow | Apportionable Flow |
|---|---|---|
(Unit: dam3) | ||
1977 | 88,996 | 90,451 |
1978 | 79,806 | 85,357 |
1979 | 361,000 | 299,000 |
1980 | 114,000 | 63,000 |
1981 | 67,600 | 41,775 |
1982 | 249,920 | 194,738 |
1983 | 343,600 | 233,617 |
1984 | 84,548.5 | 34,683 |
1985 | 227,320 | 144,218 |
1986 | 147,610 | 144,920 |
1987 | 83,660 | 45,549 |
1988 | 23,835 | 5,708 |
1989 | 57,030 | 91 |
1990 | 170,010 | 85,854 |
1991 | 146,000 | 52,321 |
1992 | 167,320 | 92,783 |
1993 | 153,830 | 60,872 |
1994 | 389,200 | 326,977 |
1995 | 441,000 | 430,000 |
1996 | 718,000 | 530,000 |
1997 | 597,000 | 471,000 |
1998 | 199,000 | 96,500 |
1999 | 677,000 | 471,000 |
2000 | 163,000 | 76,480 |
2001 | 338,460 | 318,610 |
2002 | 83,110 | 18,200 |
2003 | 285,310 | 161,980 |
2004 | 176,490 | 76,600 |
2005 | 443,280 | 333,133 |
2006 | 441,700 | 277,101 |
2007 | 436,000 | 264,959 |
2008 | 128,000 | 44,800 |
2009 | 173,000 | 139,000 |
2010 | 757,000 | 438,172 |
Total | 9,012,636 | 6,149,449 |
Apportionable flows are calculated for the Red Deer River near Erwood, Saskatchewan that is slightly upstream of the Saskatchewan-Manitoba border (station 05LC001).
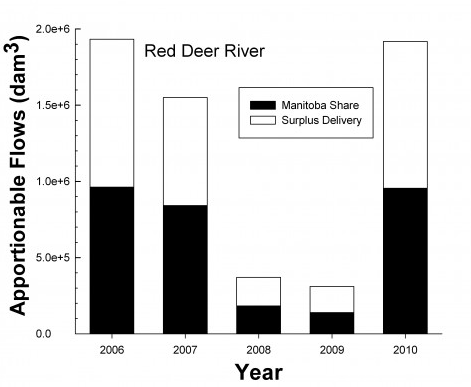
The black bar shows the amount of apportionable flows that were required to be delivered by Saskatchewan to Manitoba. The white bar shows the flow surplus amounts that were delivered in excess of required flows. The combined black (provincial share) and white (surplus) stacked bars show the total recorded flows. On the y-axis, the number following the "e" in the Scientific Notation shows how many zeros should be placed to the right of the decimal place.
Under the Master Agreement on Apportionment, Manitoba's share is 50% of the apportionable flows of the Red Deer River slightly upstream of the Saskatchewan-Manitoba border.
Saskatchewan has always met their delivery requirements throughout the entire data record.
Apportionable flows have only been calculated since 2006 although flows have been recorded for longer.
You can copy and paste flow data presented below into a spreadsheet or word processing file.
Year | Recorded Flow | Apportionable Flow |
|---|---|---|
(Unit: dam3) | ||
1974 | 493,263 |
|
1975 | 380,146 |
|
1976 | 512,905 |
|
1977 | 150,354 |
|
1978 | 434,147 |
|
1979 | 453,550 |
|
1980 | 163,511 |
|
1981 | 134,924 |
|
1982 | 204,181 |
|
1983 | 535,944 |
|
1984 | 618,945 |
|
1985 | 588,748 |
|
1986 | 409,322 |
|
1987 | 212,714 |
|
1988 | 348,327 |
|
1989 | 106,702 |
|
1990 | 229,034 |
|
1991 | 83,362 |
|
1992 | 121,431 |
|
1993 | 461,365 |
|
1994 | 314,000 |
|
1995 | 756,000 |
|
1996 | 751,000 |
|
1997 | 649,000 |
|
1998 | 242,000 |
|
1999 | 313,000 |
|
2000 | 317,000 |
|
2001 | 52,200 |
|
2002 | 65,500 |
|
2003 | 144,000 |
|
2004 | 468,000 |
|
2005 | 991,000 |
|
2006 | 1,932,607 | 1,924,384 |
2007 | 1,550,000 | 1,684,060 |
2008 | 370,000 | 366,000 |
2009 | 310,000 | 278,000 |
2010 | 1,917,500 | 1,908,500 |
Total Since 2006 | 6,080,107 | 6,160,944 |
Apportionable flows are calculated for the Saskatchewan River at the Saskatchewan-Manitoba border.
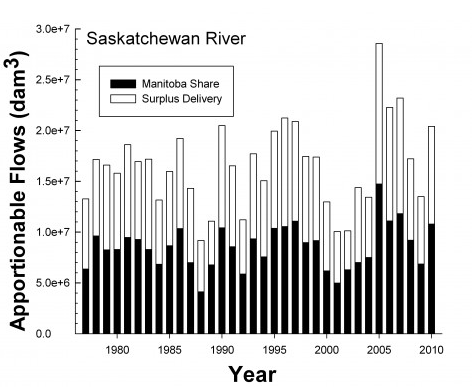
The black bar shows the amount of apportionable flows that were required to be delivered by Saskatchewan to Manitoba. The white bar shows the flow surplus amounts that were delivered in excess of required flows. The combined black (provincial share) and white (surplus) stacked bars show the total recorded flows. On the y-axis, the number following the "e" in the Scientific Notation shows how many zeros should be placed to the right of the decimal place.
Under the Master Agreement on Apportionment, Manitoba's share is 50% of the apportionable flows of the Saskatchewan River.
Saskatchewan has always met their delivery requirements throughout the entire data record.
Flow data presented below can be copied and pasted into a spreadsheet or word processing file.
Year | Estimated Flow* | Apportionable Flow |
|---|---|---|
(Unit: dam3) | ||
1977 | 13,273,498 | 12,724,599 |
1978 | 17,145,398 | 19,242,317 |
1979 | 16,600,000 | 16,500,000 |
1980 | 15,800,000 | 16,600,000 |
1981 | 18,600,000 | 18,938,000 |
1982 | 16,940,000 | 18,554,000 |
1983 | 17,177,000 | 16,583,000 |
1984 | 13,159,000 | 13,674,000 |
1985 | 15,967,000 | 17,320,000 |
1986 | 19,224,000 | 20,701,000 |
1987 | 14,303,000 | 14,004,000 |
1988 | 9,177,000 | 8,245,000 |
1989 | 11,069,000 | 13,556,000 |
1990 | 20,484,000 | 20,861,000 |
1991 | 16,530,000 | 17,105,420 |
1992 | 11,217,6000 | 11,734,000 |
1993 | 17,710,000 | 18,658,000 |
1994 | 15,057,000 | 15,128,000 |
1995 | 19,948,000 | 20,745,000 |
1996 | 21,235,000 | 21,090,000 |
1997 | 20,897,000 | 22,139,000 |
1998 | 17,457,000 | 17,952,000 |
1999 | 17,385,000 | 18,317,000 |
2000 | 12,973,000 | 12,371,000 |
2001 | 10,057,000 | 9,967,000 |
2002 | 10,120,000 | 12,574,000 |
2003 | 14,380,000 | 14,029,000 |
2004 | 13,429,000 | 15,008,000 |
2005 | 28,576,000 | 29,475,000 |
2006 | 22,268,000 | 22,214,000 |
2007 | 23,189,000 | 23,633,000 |
2008 | 17,220,000 | 18,400,000 |
2009 | 13,500,000 | 13,727,000 |
2010 | 20,406,000 | 21,574,000 |
Total | 663,431,896 | 583,343,336 |
* Estimated flow at the Saskatchewan-Manitoba border is computed using recorded flow of the Saskatchewan River at The Pas minus 1.31 times the recorded flow of Carrot River near Turnberry.
Apportionable flows are calculated for South Saskatchewan River below the junction of the Red Deer River.
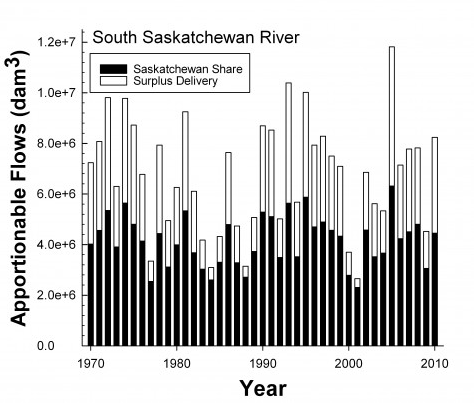
The black bar shows the amount of apportionable flows that were required to be delivered by Alberta to Saskatchewan. The white bar shows the flow surplus amounts that were delivered in excess of required flows. The combined black (provincial share) and white (surplus) stacked bars show the total recorded flows. On the y-axis, the number following the "e" in the Scientific Notation shows how many zeros should be placed to the right of the decimal place.
Under the Master Agreement on Apportionment, Saskatchewan's share is 50% of the apportionable flows. Section 2(c) of Schedule A of the Agreement states that Alberta has the option to measure flows of the Red Deer River and South Saskatchewan River below the confluence of the Red Deer River.
These two rivers contribute to the waters that Saskatchewan receives from the same river system so are combined.
Apportionable and recorded flows at the South Saskatchewan River below Red Deer are determined by adding the flows of two nearby sites (Red Deer River near Bindloss, Alberta and South Saskatchewan River at the Alberta-Saskatchewan border).
Alberta has always met their delivery requirements at each of the three apportionment points.
The flow data record for the South Saskatchewan River below the junction of the Red Deer River are provided below. The apportionment point is slightly downstream of the Alberta-Saskatchewan border.
You can copy and paste the flow data into a spreadsheet or word processing file.
Year | Recorded Flow | Apportionable Flow | |
|---|---|---|---|
(Unit: dam3) | |||
1970 | 7,230,000 | 8,039,000 | |
1971 | 8,070,000 | 9,120,000 | |
1972 | 9,804,000 | 10,689,000 | |
1973 | 6,300,000 | 7,810,000 | |
1974 | 9,781,000 | 11,281,000 | |
1975 | 8,721,000 | 9,605,000 | |
1976 | 6,772,000 | 8,277,000 | |
1977 | 3,347,000 | 5,085,000 | |
1978 | 7,936,000 | 8,876,000 | |
1979 | 4,951,000 | 6,230,000 | |
1980 | 6,250,000 | 7,990,000 | |
1981 | 9,247,000 | 10,671,000 | |
1982 | 6,107,000 | 7,355,000 | |
1983 | 4,216,000 | 6,060,000 | |
1984 | 3,093,000 | 5,205,000 | |
1985 | 4,321,000 | 6,604,000 | |
1986 | 7,638,000 | 9,585,000 | |
1987 | 4,733,000 | 6,565,000 | |
1988 | 3,146,000 | 5,427,000 | |
1989 | 5,070,000 | 7,464,000 | |
1990 | 8,694,000 | 10,571,000 | |
1991 | 8,524,000 | 10,214,000 | |
1992 | 5,016,000 | 6,977,000 | |
1993 | 10,387,000 | 11,275,000 | |
1994 | 5,678,000 | 7,038,000 | |
1995 | 10,014,000 | 11,748,000 | |
1996 | 7,932,000 | 9,398,000 | |
1997 | 8,282,000 | 9,778,000 | |
1998 | 7,500,000 | 9,126,000 | |
1999 | 7,093,000 | 8,661,000 | |
2000 | 3,698,000 | 5,577,000 | |
2001 | 2,656,000 | 4,612,000 | |
2002 | 6,854,000 | 9,144,000 | |
2003 | 5,612,000 | 7,042,000 | |
2004 | 5,334,000 | 7,326,000 | |
2005 | 11,813,000 | 12,631,000 | |
2006 | 7,140,000 | 8,467,000 | |
2007 | 7,773,000 | 9,017,000 | |
2008 | 7,820,000 | 9,600,000 | |
2009 | 4,522,000 | 6,119,000 | |
2010 | 8,239,000 | 8,895,000 | |
| Total | 271,636,000 | 341,154,000 | |
The most significant interjurisdictional water management arrangement in Canada is the Master Agreement on Apportionment.1986 Pearse Inquiry on Federal Water Policy